About Measures Portlets
Measures portlets display tabular data from a cBase, cPlan, marker, DiveBook, or Spectre Dive file. You can customize how the data appears on a portal page by using formatting options, colors, and other visual indicators.
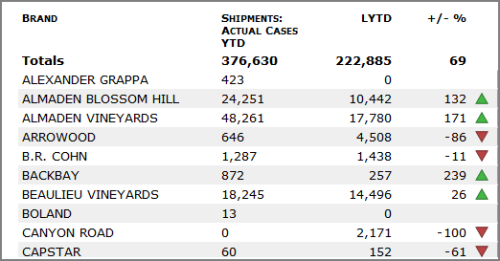
You can specify which summary columns appear on the portlet, and whether the summary data is presented as alphanumeric text or as an indicator. Column data can be used more than once and displayed as different types. In the example above, the change in data values from last year (+/- %) is displayed as text in one column and as an indicator an another column.
You can enable diving on a measures portlet and specify which dimensions are available for diving. When this option is enabled, the background color of the row changes when you place the pointer on it and clicking anywhere on a row opens a context menu that lists diveable dimensions.
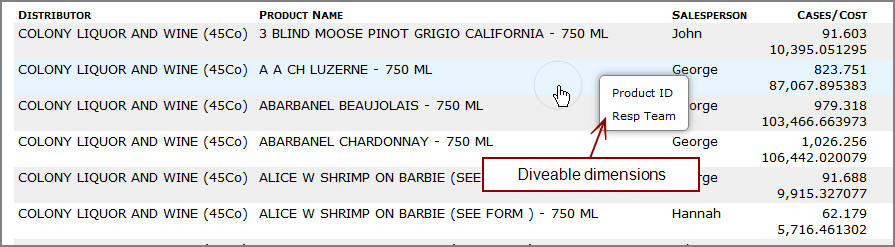
Users can click a dimension on the context menu to dive on it.
You can set the column width on measures portlets. Column data that is longer that the specified column width are truncated and appended with an ellipsis. Placing the pointer on the truncated data opens a tooltip that shows the complete data.
NOTE: Measures portlets display
Example:
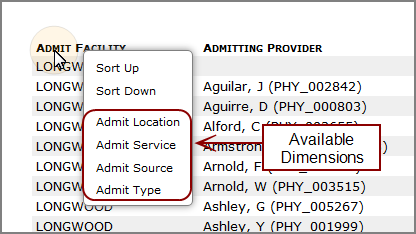
In this example, if a user selects Admit Location from the list, the portlet replaces the Admit Facility values column with Admit Location values.

TIP: If the page displays a chart portlet and a measure portlet, you can set a chart portlet option to synchronize the dimension that displays in the chart with the dimension that displays in the measure portlet. When this option is enabled, and the user switches dimensions on the measures portlet, the chart portlet also updates to show data for the new dimension. For more information, see Synchronizing Chart Portlets with Measures Portlets.
NOTES:
In DivePort 7.1, legacy measures portlets and diver portlets are migrated into an updated measures portlet style.
Measures portlets are limited to displaying 100,000 rows from a dive, cplan, cbase, or marker file.
If you use HTML code as a data source, DivePort sanitizes the code and removes potentially harmful JavaScript before rendering the HTML in the measures portlet.
Measure Factory measures portlets automatically filter the window using the union of the column time series filters.
See also Adding an Indicator Column to a Measures Portlet.