About Matrix Portlets
A matrix portlet displays tablular views of cPlan data with Measure Factory measures.
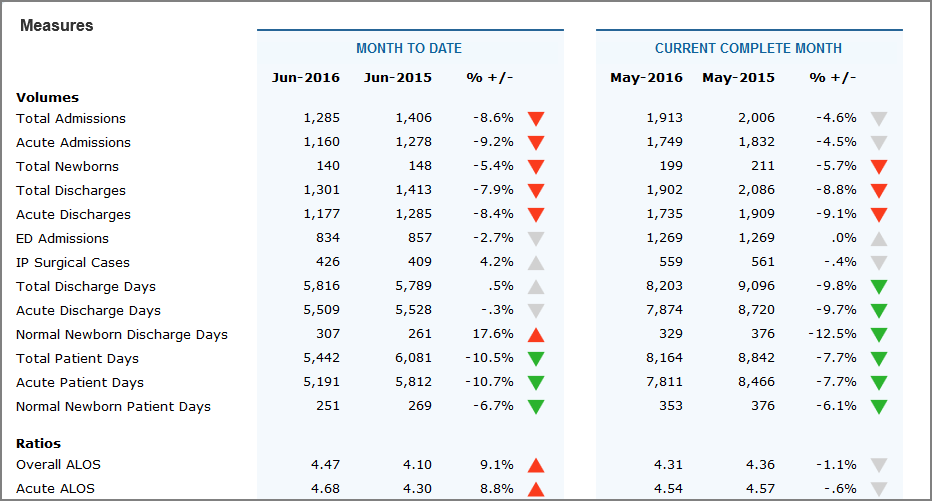
When you create a matrix portlet, you select the measures (called lines in the portlet creation wizard) that typically appear in the left-most column of the portlet, and the other columns display data regarding that measure.
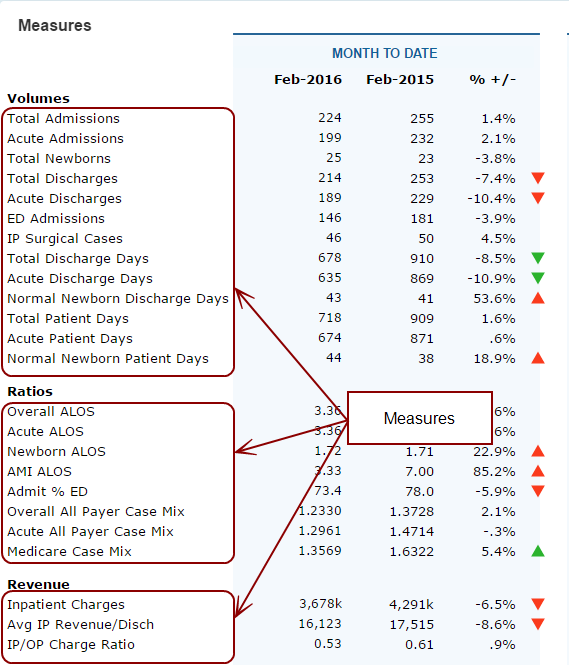
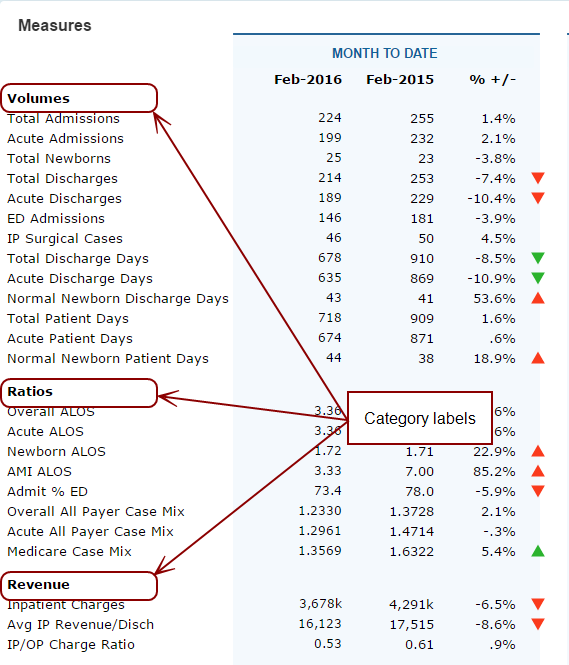
The ![]() lines can be grouped into
lines can be grouped into ![]() categories to make the presentation more useful.
categories to make the presentation more useful.
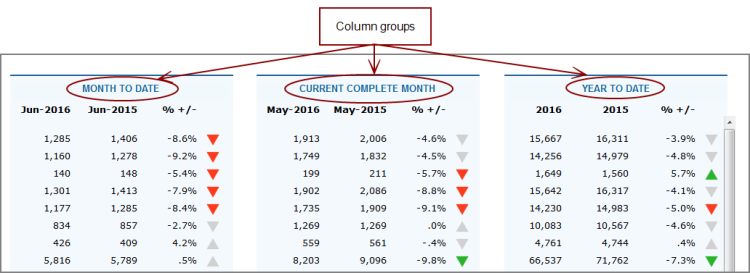
Columns can also be grouped. This ![]() example shows three column groups, each of which has four columns.
example shows three column groups, each of which has four columns.
If the matrix portlet size prevents it from displaying all data, scroll bars are added to the portlet.
- During a horizontal scroll operation, the leftmost column remains fixed in place if:
- It is the measures column.
- It is not part of a column group.
- There are multiple columns in the portlet.
- None of the portlet columns Overflow setting is Wrap text.
- Column headings remain visible during a vertical scroll operation.
- Increasing the portlet size to accommodate the data width can eliminate the horizontal scroll bar.
See also Adding an Indicator Column to a Matrix Portlet.