About Gantt
A Gantt chart is a horizontal bar chart that is used specifically to show a project schedule, status, and task dependencies.

-
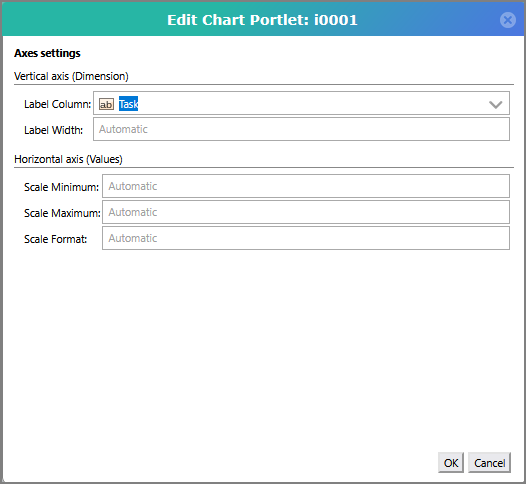
The vertical axis shows project tasks.
-
The horizontal axis shows the project timeline.
-
The width of the bars show the duration of each task.
-
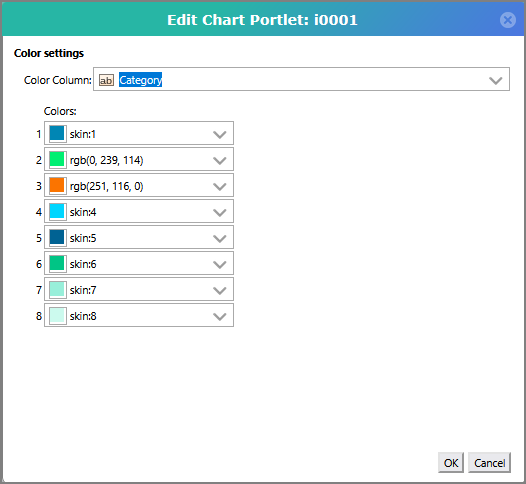
Colors indicate a category to which a task is assigned.
-
Arrows can be drawn between bars to indicate dependencies. In this example, the arrow indicates that High Level Analysis must be complete before Core Module Analysis can begin.

Gantt chart options
When you create a Gantt chart, you must specify:
-
A Dimension with task data
-
A Start value
-
An End value
-
A color column
Optionally, you can customize the appearance of the chart, including colors and labels for the bars and adding dependency arrows.
Creating a
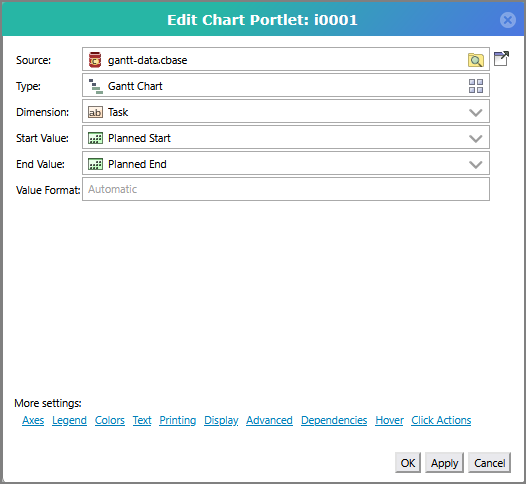
You must specify the following:
-
Source The cBase with the data the chart is using.
-
Dimension The dimension that contains task data.
-
Start Value The dimension that contains the starting dates for each task.
-
End Value The dimension that contains the ending dates for each task.
NOTE: Categories and dependencies are defined in the cBase.
See also Gantt Chart Options.