Building a Dashboard
DivePort offers many types of portlets that you can use to display KPIs on a dashboard. This section provides an example of how a dashboard page is developed.
Before you begin:
- Determine the KPIs that you want to display, and the manner (type of portlets) in which you want to display them.
- Determine the metrics that provide the most meaningful data to spot trends that you want to monitor.
- Consider using a mockup portlet to preview the page layout.
- Review Tips for Effective Dashboard Design.
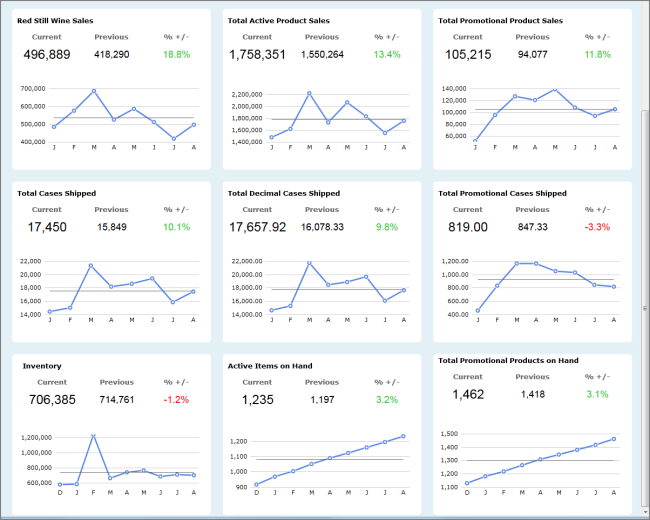
This example supposes a scenario in which a distributor wants to use a dashboard to monitor the following KPIs:
- Current month sales, in dollars, compared to last month's sales, especially for red wine, active products, and promotional products.
- Current month product shipments, in cases, compared to last month.
- Current inventory compared to last month.
- Trends for the last 12 months.
The developer has determined that they must create 10 objects using the following measures:
- Total Sales
- Red Still Wine Sales
- Total Active Product Sales
- Total Promotional Product Sales
- Total Cases Shipped
- Total Decimal Cases Shipped
- Total Promotional Cases Shipped
- Ending Inventory
- Ending Active Items on Hand
- Ending Items on Hand
Planning the Layout
Because the total sales is the most important, it will be placed at the top of the ![]() dashboard. The other nine objects will be added beneath it, in a pattern of three rows each containing three objects.
dashboard. The other nine objects will be added beneath it, in a pattern of three rows each containing three objects.

Determine if you want to include QuickViews or labels at the top of the page, and be sure to include these items when planning the layout.
The next step is to calculate the size of the objects. DI recommends a maximum dashboard width of 1320px to avoid a horizontal scroll bar. Also, plan for a 20px margin and 20-30px space between objects. Following these guidelines, you can begin to create the objects.
TIP: On the Page Settings dialog box, set the Snap-to-grid pixels option to 10 to ensure consistent object alignment.
Total Sales Object
This object will display three indicator portlets, two chart portlets, and six text background portlets on a rectangle background portlet.
- Add a rectangle background portlet.
-
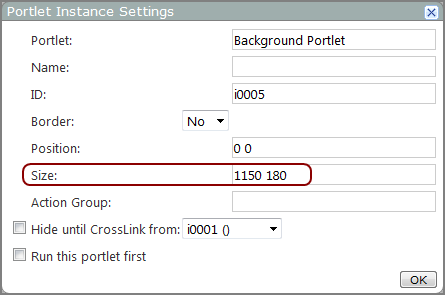
On the Portlet Instance Settings
 dialog box, set the size to the value that you calculated. In this example, 1150x180px.
 -
Move the portlet to provide a 20px left margin.
NOTE: Be sure to reserve space at the top for any planned QuickView portlets or page labels.
-
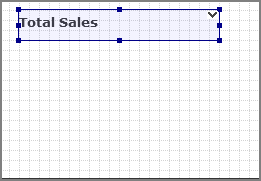
Add a text background
portlet to the upper left corner of the rectangle to label the portlet Total Sales. -
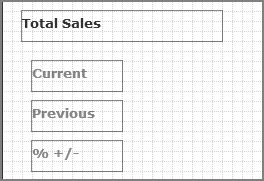
Add another three text background
portlets as labels for the Current, Previous, and % +/- data values.NOTE: Because these labels require less prominence, a lighter font color is used.
-
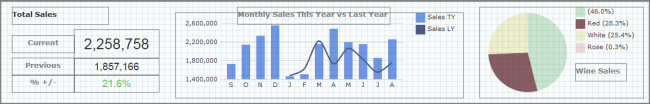
Add three text indicator
portlets to show the Total Sales value of the current complete month, previous complete month, and the percent variance between the two. NOTE: Notice the larger font for the current value, and threshold colors to indicate positive or negative variance.
-
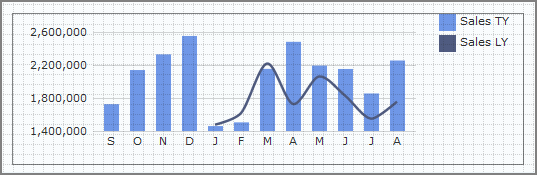
Add a chart
portlet to show the changes of monthly sales over the last 12 months, and compare the data with the same time period last year. -
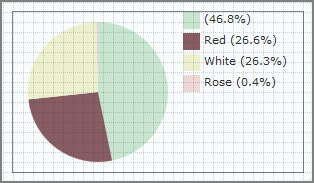
Add a pie
chart to show the percent sales of types of wine. -
Add text background
portlets to label the charts. -
Save the page.


Sales Objects
Each sales object shows the current value, previous value, % deviation and a chart.
- Add a rectangle background portlet.
-
On the Portlet Instance Settings dialog box, set the size to the value that you calculated for the sales object. In this example, 370x300px.
-
Move the portlet to provide a 20px left margin and 20px padding between it and the Total Sales portlet.
-
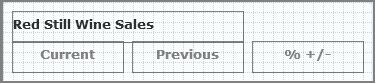
Add a text background portlet to the upper left corner of the rectangle to label the portlet Red Still Wine Sales.
-
Beneath the text background portlet, add another three text background
portlets as labels for the Current, Previous, and % +/- data values.NOTE: Because these labels require less prominence, a lighter font color is used.
- Move the labels to provide even spacing between them.
-
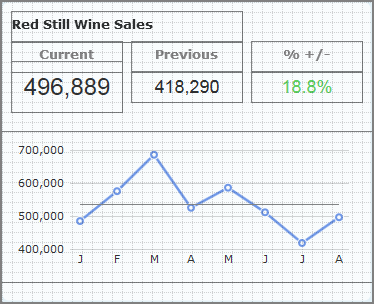
Add three text indicator
portlets to show the Total Red Still Wine Sales value of the current complete month, previous complete month, and the percent variance between the two. NOTE: Use a larger font for the current value, and threshold colors to indicate positive or negative variance.
-
Add a line chart
portlet to show the changes of monthly Total Red Still Wine Sales over the last 12 months. -
Save the page.

Remaining objects
The other eight dashboard objects are similar to the Red Still Wine Sales object, but they each display a different measure. Repeat the steps described in Sales Objects but instead of using the Total Red Still Wine Sales measure in steps 4, 7, and 8, use one of the following measures for each object.
- Total Active Product Sales
- Total Promotional Product Sales
- Total Cases Shipped
- Total Decimal Cases Shipped
- Total Promotional Cases Shipped
- Inventory
- Active Items on Hand
- Total Promotional Products on Hand
Optional Steps
- Add a QuickView Portlet to the page. See Adding a QuickView Portlet.
- Add click actions. See Adding, Editing, or Removing a Click Action.
- Add an Analysis Portlet on a new page (requires a Measure Factory license). See Adding an Analysis Portlet.