There is no shortage of data when it comes to climate change. Some of it is daunting, such as the data showing how human activities have caused the planet’s global average surface temperature to trend warmer. Some of the data is missing, as some corporations fail to respond to environmental transparency requests unless it is required by law. But almost all of the data is usable in one way or another in the effort to combat global warming.
Whether it’s presented directly to government officials in order to enact change, or simply raising awareness of potential issues at a local level, data plays a major role in climate change and the efforts to curb it. Here is a look at how some of that specific data can make a difference.
Some data is out of this world
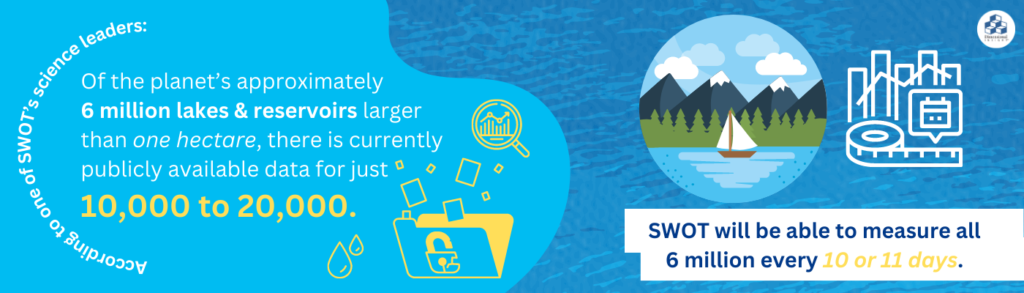
NASA recently embarked on an unprecedented data gathering mission. In a joint mission NASA is leading with the French National Center for Space Studies, the Surface Water and Ocean Topography satellite (SWOT) will track the Earth’s bodies of water in more detail than ever before.
According to one of SWOT’s science leaders, of the planet’s approximately 6 million lakes and reservoirs larger than one hectare, there is currently publicly available data for just 10,000 to 20,000. SWOT will be able to measure all 6 million every 10 or 11 days. It will do so by bouncing radar off the surface of the bodies of water, enabling scientists to measure and track the elevation, extent and movement of water across the planet.
Another high-profile project takes researchers to the ends of the Earth, though they don’t have to travel to outer space. Scientists have been trying to study the warming ocean water in Antarctica, particularly Thwaites Glacier, one of the fastest-shrinking glaciers on the continent. Their aim is to get a sense of the water that is melting Thwaites, also known as the Doomsday Glacier, by dropping torpedo-shaped probes into cracks in the ice that will send information back to their computers. The scientists would use the data to get a sense of how soon parts of the glacier could cause sea levels to rise to levels that would threaten or destroy low-lying coastlines.
The impact where you live
The average person might not be able to fully understand the kinds of numbers coming from, for example, the waters beneath Thwaites Glacier. But other data collected by scientists and researchers can help inspire change at an everyday level.
The New York Times recently published heat maps showing the climate impact of different neighborhoods in America. The maps were based on research from the University of California, Berkeley, and data produced through a partnership with a consulting firm. The research estimated consumption-based emissions, where the emissions are assigned to the households and people who are using electricity, driving cars or taking planes, buying goods, and eating food. That’s opposed to tracking emissions from a source like a coal-burning plant, for example.
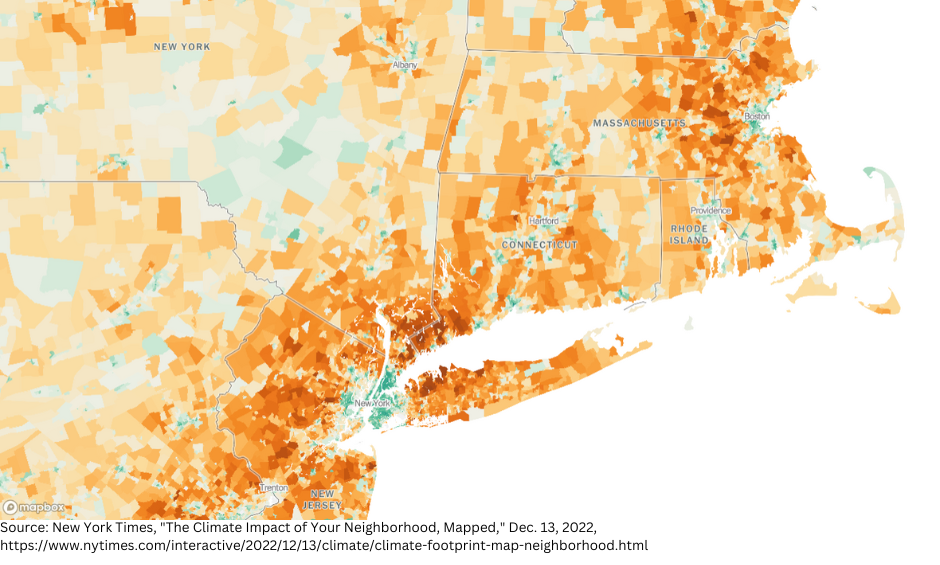
The maps show that, on average, households in denser neighborhoods closer to city centers tend to be responsible for fewer planet-warming greenhouse gases than households in the rest of the country. The reasons include the fact that these households tend to be smaller homes or apartments that require less energy to heat and cool, and the people who live there can more easily access public transportation or walk from place to place. The further you get away from city centers, homes increase in size and residents tend to drive more and for longer distances.
The data isn’t perfect. Just because you live in an area where emissions are judged to be high doesn’t mean everyone is a contributor. A house could have solar panels, for example. But the data can certainly start a conversation about the areas in which we live and how to lessen the negative impacts on the environment.
Already some of this data has been used to try to develop such strategies. The article cites the work officials are doing in King County, Washington to increase recycling and reduce food waste to try to reduce the region’s consumption-based footprint. Some experts want the data to inform how cities build new homes, but often zoning restrictions prevent new, smaller homes from being built in more dense environments.
The Times maps allow users to zoom in on different cities, down to individual neighborhoods to see what the average household emissions look like across the country. Whether it’s a global look at water from outer space, or hyper-local down to the street you live on, scientists are working to gather as much data on climate change as possible. The biggest changes can only come after that data is analyzed and shared in a way that people understand in terms of how they can help make a difference.

- Summer is an Opportunity for Digital Transformation in Education - April 17, 2024
- Your Car is Tracking More than Miles per Hour - April 11, 2024
- Data Can Help Provide Equal Footing in Cannabis Space - April 3, 2024