The ever-increasing digitization of the distribution business is generating ever-increasing amounts of data – and making it harder to discern which metrics are the most important for profitability and growth. For distributors, inventory is one of the most important drivers of success, thus underlining the need for insightful and actionable inventory analytics.
In my last blog, I presented key metrics that track inventory alone and the interplay of inventory and employees. Today I will focus on inventory and sales numbers. Here are four metrics related to inventory and sales that will help distributors up their game.
Inventory and sales metrics
- Gross Margin Return on Investment (GMROI)
- Rate of return
- Sell through rate
- Lost sales
For each of these measurements, businesses should track them alongside a goal. It can be a goal generated by your own company or an industry-wide goal. Within many industries, these metrics are tracked and published by trade associations and private companies, including ReferenceUSA, BizStats, and Risk Management Association, among others.
As with all analytics, these metrics are most useful when they are presented in ways that are simple, clear, and actionable, allowing the user to dive into the details behind each measurement.
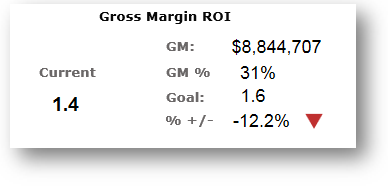
GMROI
GMROI stands for “gross margin return on investment” and it is a very important number to track. This is an inventory profitability evaluation ratio that measures a firm’s ability to turn inventory into cash above the cost of inventory. Here is how you calculate your GMROI:
Gross margin = (gain from investment – cost of inventory)
GM% = gross margin / gain from investment
GMROI = gross margin / average inventory cost
Let’s say your gross margin is $55,000 and your average inventory cost is $30,000. Your GMROI is 1.83, which means you earn $1.83 for every dollar in inventory.
Companies want their GIMROI to be as high as possible. A low GIMROI – 1 or below – signals a company running into danger, one that may not be making enough money to recoup its investment or to buy more inventory. As a benchmark, the average GIMROI in retail is 3.2. Remember that all profit comes out of your gross margin, so it needs to be large enough to cover your payroll and other operating expenses.
GMROI should be displayed against both gross margin and gross margin percentage, along with the goal.
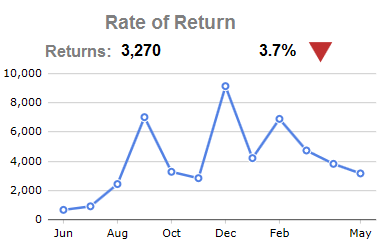
Rate of return
Returned goods cost a company money, so it is wise the track and analyze them. Costs associated with returns include picking up the goods, bringing them back to warehouse, counting them, restocking them, and adjusting inventory in the computer.
It is also smart to track the reasons behind returns. Were the items damaged? Did you send the wrong goods, or the right goods at the wrong price, or deliver them on a wrong day? Or did the customer receive something they never ordered? Monitoring the reasons for returns can reveal potential problems in your supply chain or operations as well as opportunities to address those problems.
Businesses should track the percentage of orders that are returned and display the numbers over time. The goal is a zero rate of returns – both because returns cost you money and because any return indicates a dissatisfied customer. The formula is simply returned goods divided by total orders.
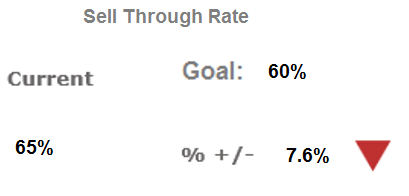
Sell through rate
Now let’s look at your sell through rate. This is a comparison of the amount of inventory you received against what is actually sold. It is a good way to assess whether you have the right amount of stock on hand and how well your investment is returning. The sell through rate is usually measured one month at a time. To calculate your sell through rate as a percentage, divide the sales during a certain period by the stock on hand.
Healthy sell through rates vary by industry, but in general, the average goal is 60%. A sell through rate of 5% means you probably have too much stock on hand to support those sales. Or it could indicate your prices are too high. In comparison, a sell through rate of 80% means you have too little inventory on hand and run the risk of running out since your sales are so strong. It also could signal you are priced too low.
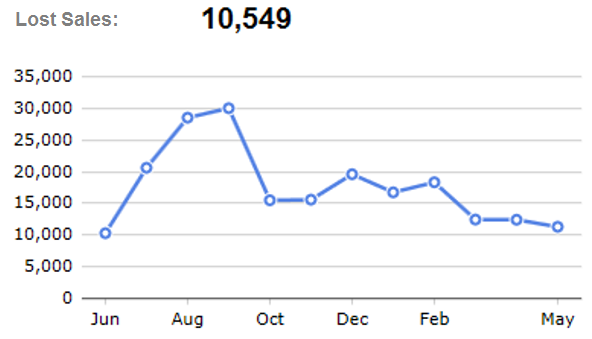
Lost sales
Finally, let’s take a look at lost sales and how to get a handle on how much money you are potentially losing when you do not have the right inventory. In order to track lost sales, your system must be configured to track and retain order line items that are fully or partially out of stock. Then you can assess how much money you are losing when an item is out of stock, represented as a dollar value over a period of time. To calculate this, you’ll need to know the average profit margin for every day the item is in stock. Multiply the number of days it was out of stock by the average profit margin when the item is in stock.
The result is best displayed as a straight number, with a graph showing the value over time. Some lost sales are OK, as you will not have your inventory full to 100% capacity all the time. However, distribution companies certainly do not want this lost sales number to get too high.
Final thoughts
There is no doubt that inventory analytics can help distributors makes better-informed buying decisions while revealing potential problems in the supply chain, operations, and pricing. But today’s abundance of data may leave distributors feeling bombarded at times, unsure which data points are most important or how to make them useful.To learn more about how analytics can optimize your inventory management, check out Dimensional Insight’s Inventory Advisor™.

- Inventory Analytics: Four Key Sales-Related Metrics to Watch - January 3, 2023
- Inventory Analytics: Two Sets of Metrics that Really Matter - December 20, 2022