Distribution is an intensely competitive business and inventory is key to determining profitability. Applying advanced analytics to inventory management is a savvy way for distributors to track their performance and gain insights that can fuel profitability and growth.
Distributors have a wide selection of metrics at their disposal that they can use to gauge their performance. Inventory metrics can be broken down into three sets: those concerned with inventory only, those that focus on the interplay of inventory and people, and those that track inventory with sales. Let’s take a closer look at the first two categories and how they can improve distributors’ performance.
Inventory-only metrics
Inventory carrying cost
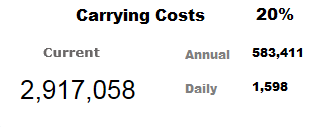
How much does it cost to carry your inventory? Too few companies can answer this question accurately – and that means they don’t know how warehousing costs are impacting their profitability. Your inventory carrying cost is not simply the cost of the inventory itself—it includes all the costs associated with your storage facility, such as rent, insurance, utilities, taxes, and depreciation. It also includes the costs related to your inventory management systems, including software applications, conveyors, and scanners.
Distributors need to carefully go through their books to determine all these costs. Often, these are calculated per year and expressed as a percentage of the cost of inventory items. To determine the true cost of your inventory, add the carrying cost to the actual cost of items in inventory.
Once you have these numbers, what is the best way to present them? As with all metrics, displays that are simple, readable, and actionable make for the most meaningful and useful insights. Inventory carrying cost is best displayed as a percentage along with your current inventory. Distributors should aim for a carrying cost of no more than 25%.
Inventory shrinkage
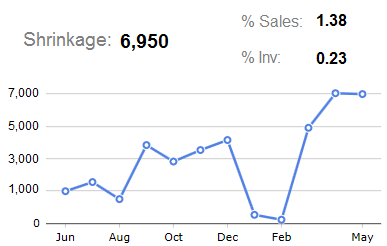
Shrinkage is a second “inventory only” metric that often yields insights. Shrinkage is the difference between what you physically have in your warehouse and stores versus what the computer thinks you have. Employee theft, shoplifting, and vendor fraud are common causes of shrinkage.
It’s useful to display shrinkage in three ways: as a dollar value, a percentage of sales, and a percentage of inventory. Companies want these numbers to be as low as possible. It’s wise to look at shrinkage numbers over time, watching for trends and opportunities to examine outliers.
Average cost per unit
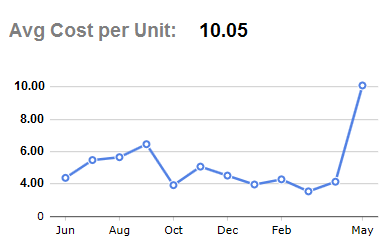
Calculating your average cost per unit and tracking it over time helps monitor costs. If you see your average cost increasing, it may mean your internal overall costs are rising or you have more expensive products coming into inventory. It also could signal there has been a potentially expensive mistake.
The formula is simple: total inventory cost divided by number of units. This is best displayed as a straight number, with a graph over time.
Inventory & people metrics
Now let’s take a look at metrics that track the performance of your warehouse workers, the people who actually handle the inventory. Tracking their performance – and sharing the numbers with them – helps the entire organization set goals and can motivate individuals to continually work to improve their performance.
Average number of units picked
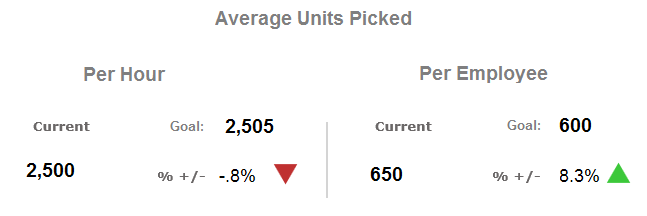
How much product is being picked every day? Every night? What is the total picked throughout the cycle? And what do you do with these numbers to maximize productivity?
A good place to start would be calculating the number of units pick per hour and the number of units picked per employee on a given shift. Then, post these numbers for your team to access The average number of units picked is best displayed in comparison to your goal, so employees can work as a team to meet that goal.
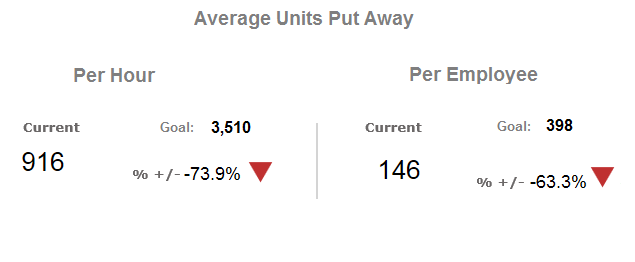
Average number of units put away
The average number of units put away is a useful metric for the receiving team to see how they are performing in putting away products received from suppliers. Again, you can slice this data per hour and per employee and the results are best displayed in tandem with the goal.
Takeaways
Beverage inventory is a complex supply chain topic, and one in which targeted analytics can deliver insights and prompt action, especially for distributors. To learn more about how analytics can optimize your inventory management, check out Dimensional Insight’s Inventory Advisor™.

- Inventory Analytics: Four Key Sales-Related Metrics to Watch - January 3, 2023
- Inventory Analytics: Two Sets of Metrics that Really Matter - December 20, 2022