There’s been a lot of discussion over the last several months in the healthcare world about social determinants of health – or SDOH. These are factors that relate to a person’s physical environment and social circumstances that impact their well-being.
Social determinants of health account for up to 80% of the impact of an individual’s health, but that data accounts for only about 20% of the information collected in a healthcare setting. That’s why providers are now looking for ways to better incorporate SDOH into population health datasets. There are some easy ways to do so – let’s examine.
SDOH – What is it and where does it come from?
Social determinants of health have an even greater impact on health than the information that’s routinely collected in healthcare settings, such as physicians’ offices, community health clinics, and hospitals. Examples of social determinants of health include things like:
- Housing
- Food and nutrition
- Income
- Employment
- Access to transportation
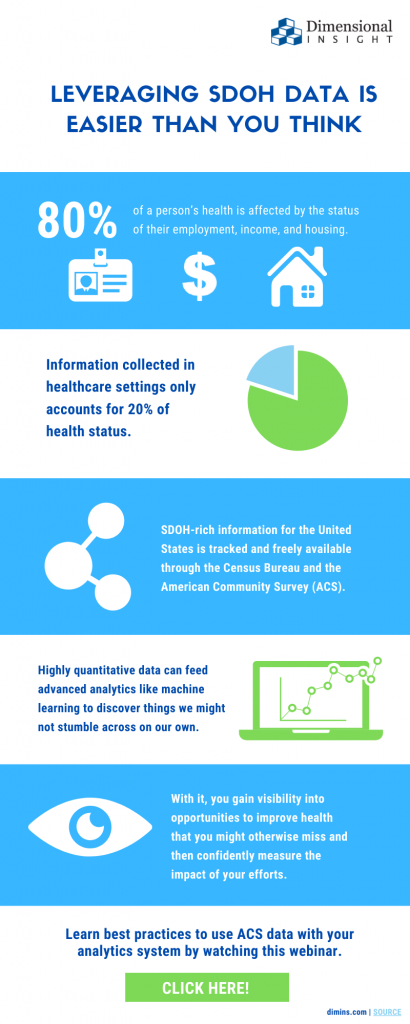
This information is easily accessible to people through the data that the Census Bureau collects in its decennial census, as well as other surveys. For example, the American Community Survey provides 5-year estimates for the entire country on demographic and social factors, and it can go down to the ZIP code, or even neighborhood level. This allows you to estimate the social characteristics of populations at various levels of granularity. All of this information is public, and absolutely free for the taking.
How do you make sense of this information?
The good news is that the American Community Survey provides a comprehensive view of information around social determinants. However, this can be almost “too much information” to comprehend and put to good use. So where would we even start to dig in?
 Fortunately, there’s been lots of work already done to help distill this information into a useful form. There is something called a “social deprivation index” (SDI), which combines a set of social determinant factors into a single number – the index – which provides a useful starting point for analyzing the social characteristics of a population.
Several countries around the world are already using SDIs to help manage the health of their populations. For example, the U.K. and New Zealand use SDIs – New Zealand uses its SDI to determine allocation of various types of resources and to explore variations in health outcomes.
A variant of the SDI was created specifically for the U.S. using social determinants from the American Community Survey’s 5-year estimates. The Robert Graham Center, a health-focused think tank based in Washington, D.C. did the analysis to determine which factors had the highest correlation with health outcomes.
Researchers selected seven factors and combined them into a social deprivation index, weighting them according to their influence on outcomes. The Graham Center’s website provides datasets with both the SDI and the contributing factors for several Census geographies, including: Census Block, ZIP code, and county. In addition, a white paper on the website describes how you can do the calculations yourself in order to take advantage of the most up-to-date American Community Survey information.
How accessible is this data to people who might not be statisticians?
The SDI does help distill the data down to something that more people can comprehend, but there’s still the issue of how to present it most effectively. Not everyone can make sense of a table of numbers.
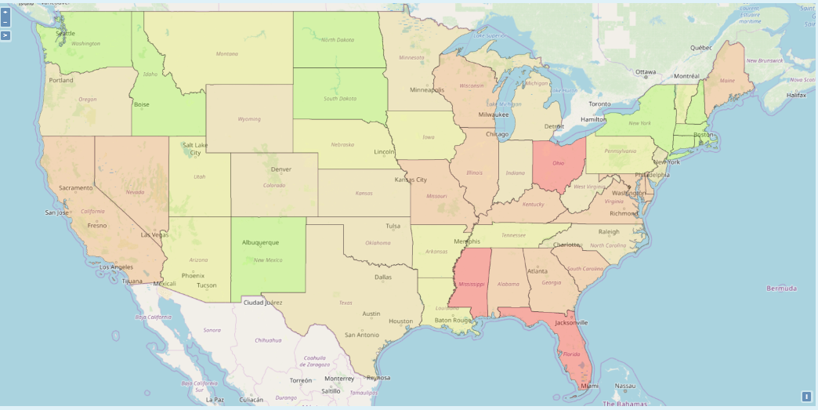
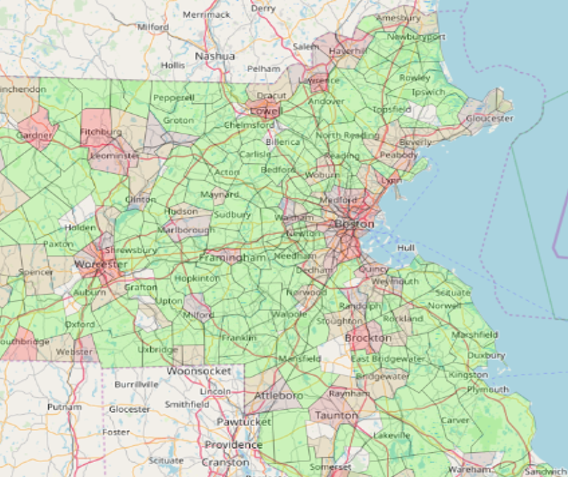
One approach that is effective is visualizing the information through maps. For example, if we summarize the SDI data for the entire U.S. at the state level by quintiles, we can see some interesting patterns, but they are very general and probably not very useful or actionable.
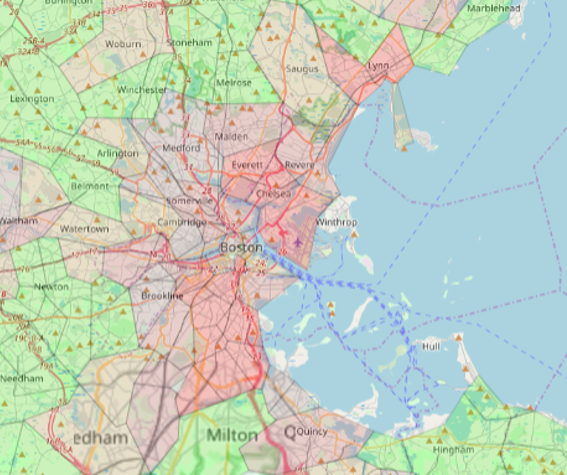
If we bring this down to the county level and focus on a region such as the Northeast, we can see some more specific patterns emerge that identify areas with higher social deprivation – however, that is still fairly general. We can then take it down to the ZIP code level, and that’s where we start to see specific pockets of social deprivation. In fact, we could continue to dive down to even more granular levels, such as the census block. There are 6 million census blocks in the U.S., so that gets us down to just a few thousand people at most.
How can we combine these estimates with information about actual people?
The SDI data is just an approximation of the social circumstances of a population, but we can fold this into information on specific individuals to give us more useful and actionable data.
For example, we can use individual level data to identify the incidence of diabetes as a proxy for health outcomes since diabetes is quite prevalent. Visually, we can go down to the ZIP code level to see clear pockets of high diabetes incidence (as measured by the number of people with diagnosed diabetes per 1,000 of population).
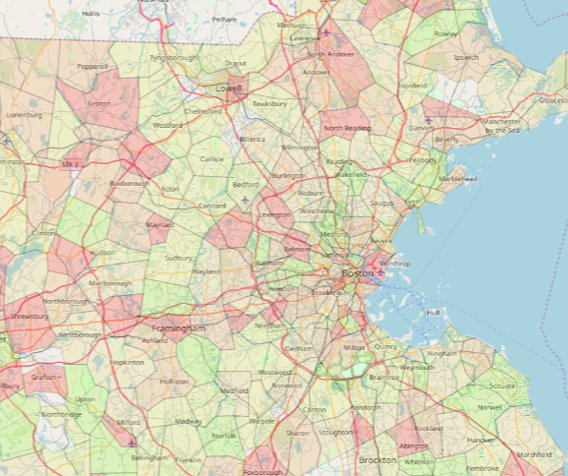
The diabetes patterns are somewhat different than SDI. So if we want to focus on segments of the population with high diabetes incidence and high SDI, we can overlay the two to see areas of opportunity where we can mitigate some of the challenges presented by things such as lack of transportation access to see the doctor.
What are some other uses and impacts of this data?
We’re just scratching the surface on what we could do with clinical data. There are lots of conditions and co-morbidities that could be added to this approach to gain a deeper perspective on health outcomes. We can also monitor the data over time to objectively measure whether our efforts are bearing fruit in terms of helping the people who need it the most.
The best news is that this doesn’t need to be that complicated. The information necessary to create this is readily available from the American Community Survey and patient-level data from electronic health records or health information exchanges.
This also provides the type of data needed to do more sophisticated analysis using machine learning and artificial intelligence techniques. However, you don’t need to start with AI. There really are opportunities to “walk before you run” when it comes to population analytics.

Kathy started her career in television news writing and producing. She then worked at a public relations agency and as a freelance writer before joining Dimensional Insight in 2013.
Kathy has presented at several events in both healthcare and wine & spirits, including the Healthcare Innovation Summit, the Healthcare IT Marketing & PR Conference (HITMC), and the WSWA Women’s Leadership Council (WLC) Conference. Kathy is a Fellow in the American College of Healthcare Executives (ACHE) and a member of Women of the Vine & Spirits.
She is also host of the Smarter Healthcare Podcast (www.smarthcpodcast.com) and is a member of the Forbes Communications Council.
Kathy holds a bachelor’s degree from Dartmouth College and an MBA from Boston University.
- Solving Hospital CEOs’ Pressing Challenges With Analytics - April 15, 2024
- Navigating the Wellness Wave: Wine & Spirits Data Strategy - April 9, 2024
- Takeaways from HIMSS24 - March 26, 2024