There’s a seemingly infinite number of wine and spirits brands that consumers can choose from, meaning competition is tough for beverage alcohol suppliers. How can brands get a leg up on sales?
The smartest companies these days are using data to support decision-making and provide competitive insights. Which areas are most important for suppliers to examine? Here are 3 examples of essential metrics to provide the insights that can power sales.
1. Inventory
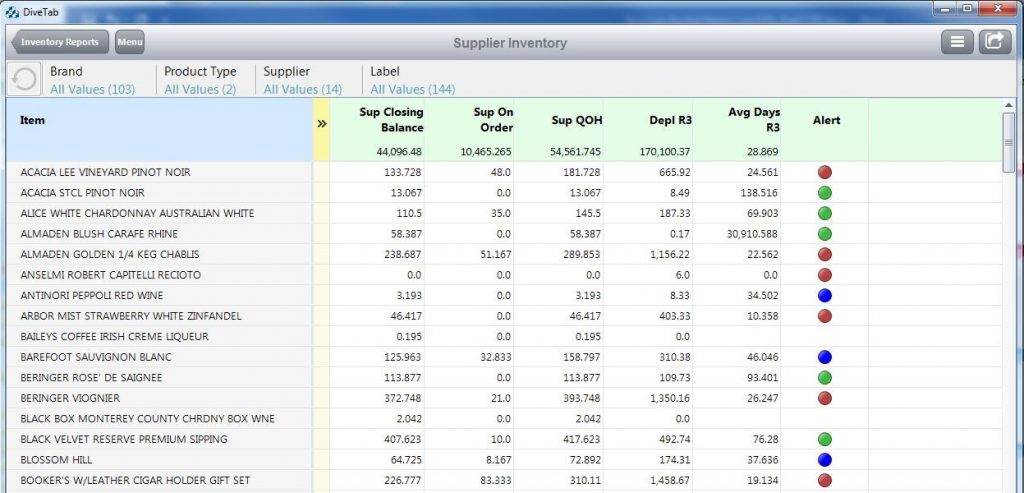
If you are a wine & spirits supplier, it’s critical that you understand your consumers’ purchases and preferences so you can tailor your products to match consumer demand. There’s nothing worse than producing product that doesn’t match what anyone wants to buy. By tracking sales and inventory data, you can get a handle on what’s selling right now – and what is staying on the shelf. Better understanding inventory will also help you minimize stock-outs and overstocks, both of which negatively impact revenue.
For example, let’s say you notice that one of your distributors is running out of a product, but you don’t have enough inventory to fill more orders. You can then identify a replacement product to offer the distributor instead of losing shelf space. This would require viewing inventory from your perspective and your distributors’ perspectives and then marrying that information with what you know about your customers’ preferences to determine the right product to offer.
2. Direct to consumer sales by channel
Measuring and analyzing sales through various distribution channels can help you better understand where consumers are interacting or purchasing your products. This metric is essential because you can use this data to strategize efforts that can increase sales, revenue, and market share.

For example, you can use the chart above to analyze how your various channel sales may be growing or shrinking, which can help in making investment decisions for future marketing efforts. Note in this case that Internet purchases are increasing over time, while sales from direct mail are decreasing over time. Once armed with this information, you can ask yourself:
Are these changes an industry trend or specific to my organization?
How and why are specific trends occurring? Once you view this initial data, you can purchase market data or read articles in industry publications to determine whether this is a company-specific or industry trend. From there, you can strategize on whether or not to change marketing efforts.
Has there been a change in my company’s marketing focus (changes in campaigns or strategy, etc.)?
Not all marketing campaigns are created equal. Some have a bigger impact than others. Taking the timeline for a marketing campaign and overlaying it with changes in sales volume can help identify successful campaigns. You can then build on these campaigns to continue sales growth.
What is the ROI for each of these channels?
Everyone wants to maximize return on investment. Different channels will have different ROIs. It can be tempting to put a majority of your marketing budget in the channel with the highest percent return. However, that can backfire in the long run. As in the stock market, diversification can be helpful. Ignoring a channel with industry wide growth can mean your company has to play catch up later, or even worse, gets left behind. It could be that the high growth channel ‘A’ with a low ROI is taking sales from channel ‘B’, the one with the higher ROI, but a downward industry volume trend.
If your company is investing mostly in channel ‘B’ with high ROI, but declining industry volume and ignoring the lower ROI channel ‘A’, you could be investing in a dying channel. It might even be why that channel is now so profitable – there is less competition because they have divested from that channel. This is where your analysis skills and knowledge of the industry come into play.
3. Points of distribution (PODs)
It’s important for you to understand how well your products are selling through each of your various distributors or retailers. This way, you can redistribute resources or reevaluate sales channels if you notice something particularly profitable (or unprofitable). You can do so through points of distribution (PODs) analysis.
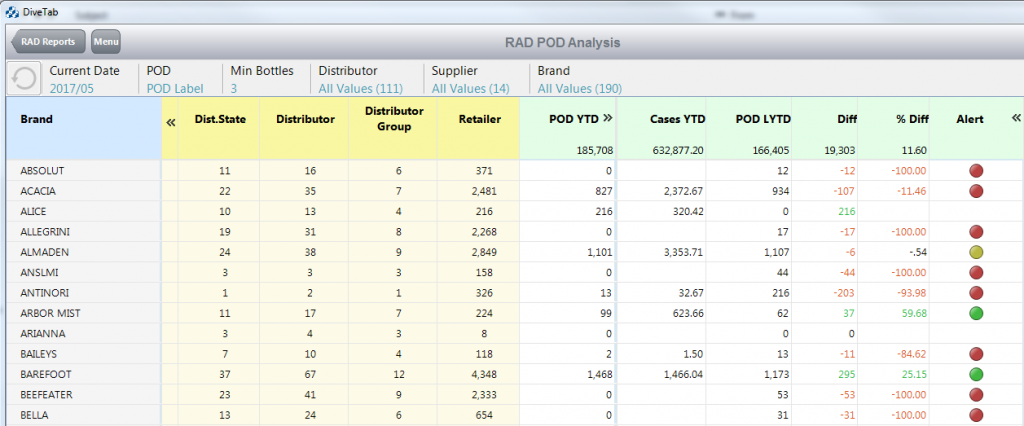
The table above is an example of Dimensional Insight’s POD report. It can be used to identify whether a brand is appearing in more stores or less stores compared to the previous year. Many suppliers use this as a measure of overall product performance. Also, if a product is selling in fewer retailers than in the past, your company can reach out to them and find out why your product is no longer being sold in their stores. It could be that consumers weren’t buying the product, and you need to offer something better tailored to their preferences. Or perhaps you need to offer the right incentives or better pricing to get the product to move.
Moving from insight to action
What is increasingly clear is that data is essential in the competitive beverage alcohol world. The information from these three metrics can help provide insight into critical sales and inventory information. However, they are not magic bullets. Once armed with the data, you can then dive deeper into the numbers or have conversations with distributors or other employees to figure out exactly how to increase sales.
Wondering which metrics are essential to beverage alcohol distributors? We’ll be taking a look at that in an upcoming blog post. Stay tuned.

- How Stamps Can Help You Make More Informed Business Decisions - January 13, 2020
- 3 Critical Metrics for Distributors - July 18, 2019
- 3 Essential Metrics for Beverage Alcohol Suppliers - June 12, 2018