After your organization has invested in a business intelligence solution, how can you assess its performance? How do you gauge its efficiency and whether the decisions you make based on its insights are good or bad? Forrester Research recently explored these questions in a report about benchmarking your company’s BI environment.
Business intelligence is an asset that turns information into a competitive advantage, so it is imperative to determine whether it is performing well or needs a tune-up. The report recommends an extensive “BI-on-BI” methodology. While the very notion of deploying BI to evaluate your BI may sound intimidating, it can be taken in baby steps. Here are some actionable ways to begin.
Forrester surveyed more than 100 professionals who use BI in late 2016 and 2014 to learn how enterprises evaluate their BI solutions. It found 86% of organizations measure their BI benchmarks quantitatively, through monitoring and analyzing BI platform logs and metadata, database management systems logs, and/or by running surveys.
Measuring efficiency
The report suggests asking the following questions to benchmark the efficiency of your company’s BI. The survey results provide useful comparisons.
- Are you using more or fewer BI platforms than your peers?
Forrester believes most large enterprises deploy at least five BI platforms, some of which are built into financial, planning, ERP, and CRM applications. In this case, more is not necessarily better, as each requires the orchestration of multiple moving parts that can be tricky to integrate and deploy.
- How many different reports and dashboards do you produce?
The research, updated in Q4 2016, finds most organizations produce 25 or fewer reports and dashboards per user, with 42% producing fewer than 10.
- Where do you deliver the information?
PCs are the most common platform reported in both 2014 (94%) and 2016 (87%). The use of mobile platforms is growing, up from 44% to 50% over the two years. At Dimensional Insight, we have seen growing interest in our DiveTab mobile solution.
Using Diver’s Site Stats to collect and analyze metrics
Analytical needs can vary widely across an enterprise and what is considered “useful” may depend on the audience. As such, Forrester also recommends collecting metrics including the number of frequently and infrequently used reports and dashboards, how quickly a query returns results, and how many clicks it takes to build a question and get an answer. Analyzing the results by users, departments, regions, lines of business, and other attributes will spotlight trends and create opportunities to learn from more efficient usage patterns.
Site Stats is a tool offered through Diver Platform and Diver Solution that collects this sort of information and helps users visualize and analyze it. The summary page provides a high-level look at usage information and trends that might be useful to a CIO.
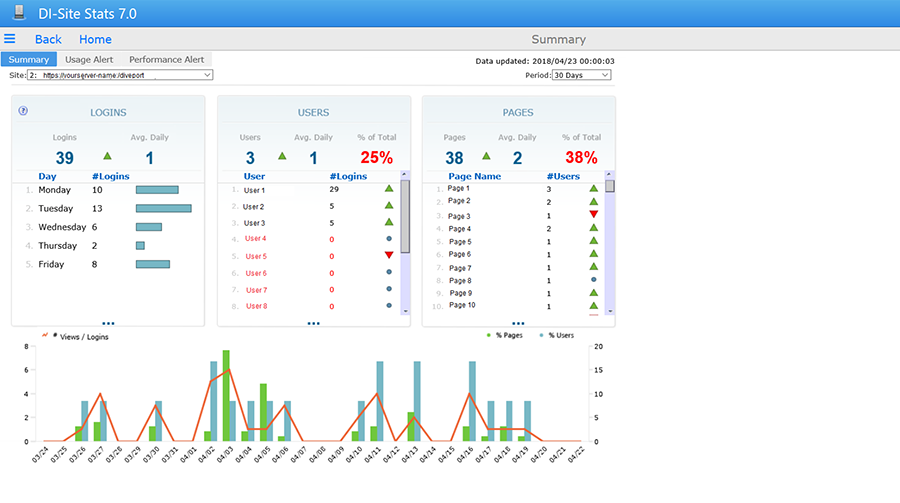
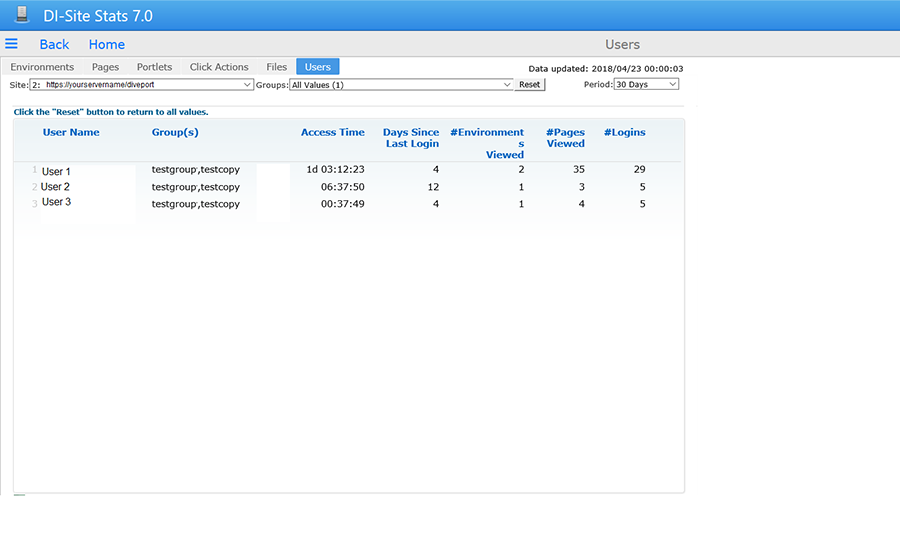
Beyond the summary page, there is tons of data about each page and user within a BI environment. Who logs on, how often, and for how long? How many pages do they view? How long they spend on the site during the period selected? Which pages, portlets, and files get the most average daily views? Which have not been used during the period selected? What data is extracted to Excel or downlinked, and by whom? In essence, every piece of data in the environment is tracked every time it is touched.
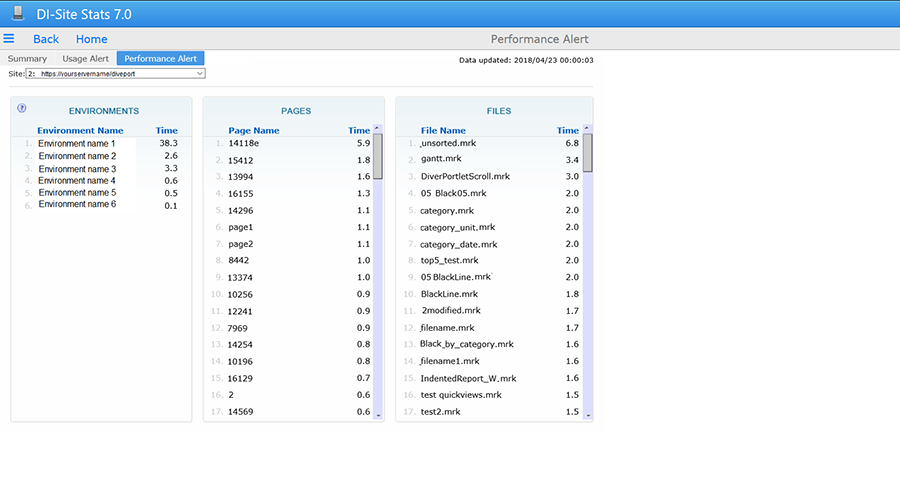
 Site Stats also provides information on how long each page takes to load. Slow times may signal poor design of a particular dive into the data. If so, our technical team can help the client redesign pages for better performance and improved efficiency.
Measuring effectiveness
Compared to efficiency, measuring BI effectiveness is trickier business. The key question to consider is the ultimate measure of BI: Do insights support verifiable facts? To answer that question, you will need to identify past predictions and go back to see if they came true. For instance, if BI flagged low inventory levels, and you ordered more items, was that a good or bad decision? Did you make or lose money on the extra inventory? Only 7% of Forrester clients report robust capabilities for such an analysis, so if your organization struggles with it, you are not alone!
Takeaways
Measuring efficiency is a good place to start assessing your BI solution and determining whether it needs fine-tuning. Diver’s Site Stats provides an out-of-the-box way to track and analyze usage, while our experts can help clients redesign dives to improve their efficiency.
A final note comes in the form of a common-sense warning from Forrester. When considering all of BI’s quantifiable measures, don’t overlook intangible benefits such as improved decision making and better insights. Remember the wise old adage, “Not everything that can be counted counts. Not everything that counts can be counted.”
Sources
- Benchmark Your BI Environment for Continuous Improvement, by Boris Evelson, Forrester Research, Inc., March 20, 2018.
- Use Human-Machine Partnerships to Continuously Improve Decisions, by Rowan Curran and Boris Evelson, Forrester, May 2016.
.jpg)
- Survey Says: Healthcare CIOs Don’t Fully Trust Their Data - November 8, 2018
- Microhospitals: How a New Healthcare Model Leverages Business Intelligence - September 25, 2018
- How New Database Technology Fuels Oil Company’s Analytics - September 20, 2018