 It’s been a busy year here at Dimensional Insight, and it’s hard to believe that 2017 is quickly wrapping to a close. 2018 promises to be just as busy, and I’m looking forward to all that we have planned!
Here on the blog, we spent 2017 writing about issues such as data governance, value-based care, and dashboard design. Which topics most interested our readers? Here’s a list of the Top 5 blog posts of 2017.
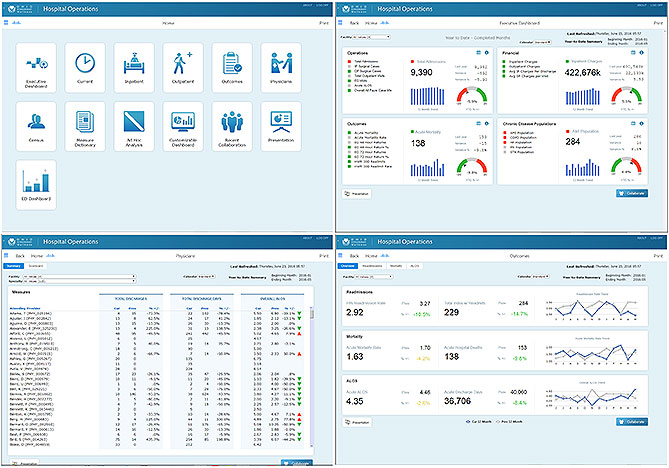
1. Data-Driven Decisions as a Driver for Change in Healthcare
How can healthcare professionals use data to make better decisions? And how do they sort through the noise to find the data that is truly meaningful? Those are the questions George Dealy set out to answer in our most popular blog post of 2017. George uses the example of our customer Western Maryland Health System to show how healthcare organizations can make significant, meaningful improvements through better use of data and analytics.
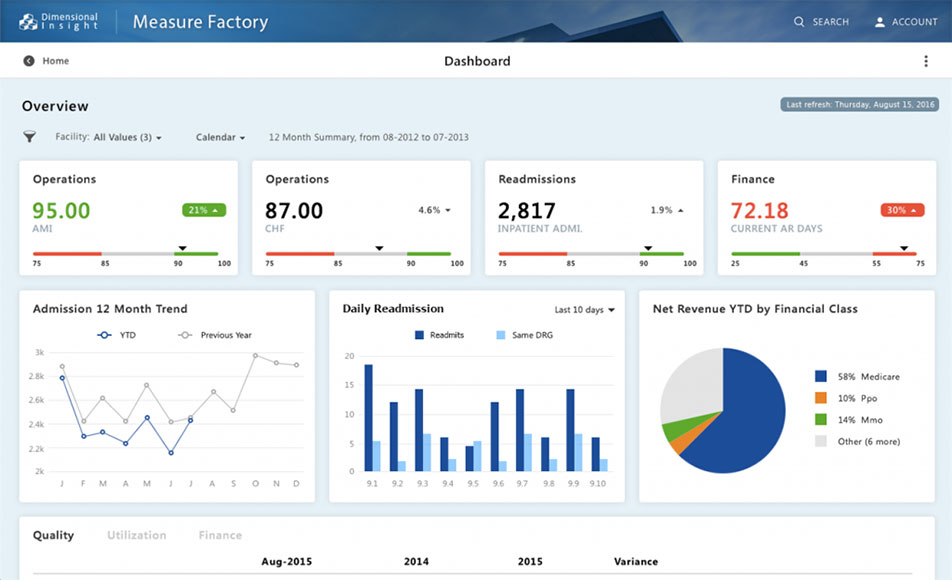
2. How to Get a Fresh Dashboard Look and Feel
Want to spruce up your dashboard to give it a more modern look? In this blog post, Rose Weinberger outlines 4 steps that will allow you to change elements such as colors, fonts, and portlet images so you have a fresher looking dashboard.
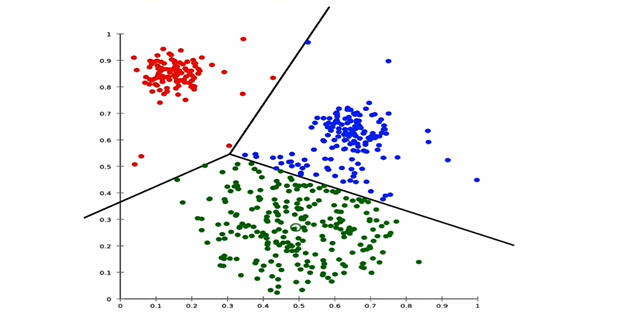
3. Integrating Statistics into Diver with R
Statistics has the power to help you both explain the past and predict the future. Interactive forecasts and predictive functionality are powerful tools, and you can build them right into your DivePort dashboards. This blog post shows you how to leverage R to do so, and also shows three kinds of analysis that can be applied to your data.
4. Takeaways from the Gartner Data & Analytics Summit
Gartner held its showcase Data & Analytics Summit in Dallas in March. I attended the event with our CEO, Fred Powers. This blog post discusses several of the themes discussed at the event, including information governance, self-service analytics, and machine learning.
By 2018, 50% of business ethics violations will occur through improper use of big data analytics. #GartnerDA @ThomasOestreich
— Kathy Sucich (@ksucich) March 6, 2017
5. Visual Standards in Dashboard Design
Style and design. They don’t mean the same thing. How can you use both when you are designing a dashboard? In this blog post, Rose Weinberger takes a look at the most important visual elements you should consider when you are looking to create the right dashboard.
What was your favorite blog post of 2017? Is there something you’d like us to write about in 2018? Let us know in the comments below.

Kathy started her career in television news writing and producing. She then worked at a public relations agency and as a freelance writer before joining Dimensional Insight in 2013.
Kathy has presented at several events in both healthcare and wine & spirits, including the Healthcare Innovation Summit, the Healthcare IT Marketing & PR Conference (HITMC), and the WSWA Women’s Leadership Council (WLC) Conference. Kathy is a Fellow in the American College of Healthcare Executives (ACHE) and a member of Women of the Vine & Spirits.
She is also host of the Smarter Healthcare Podcast (www.smarthcpodcast.com) and is a member of the Forbes Communications Council.
Kathy holds a bachelor’s degree from Dartmouth College and an MBA from Boston University.
- Solving Hospital CEOs’ Pressing Challenges With Analytics - April 15, 2024
- Navigating the Wellness Wave: Wine & Spirits Data Strategy - April 9, 2024
- Takeaways from HIMSS24 - March 26, 2024