 As an analyst, you can perform the most sophisticated analysis and draw the most compelling conclusions, but without a way to share these with others, your hard work stays with you. So how to best communicate when it comes to quantitative data? In a nutshell: words and pictures.
In this blog, we offer practical suggestions on how to tell compelling stories through data visualization.
We will draw on the work of Nathan Yau, a Ph.D in statistics who has provided us with guidance throughout this Practical Analysis series. Yau founded Flowing Data, a website that features an extensive and eclectic collection of interesting visualization examples and advice on how to create them. Topics range from the generosity of restaurant tipping across different states to divorce patterns by occupation. In a testimony to the growing interest in analysis, Flowing Data has gone from a sideline project for Yau to a community of over one million visitors per year. Subscriptions allow him to make a living from the comfort of his home office!
Why would someone with an extensive background in formal mathematics and statistics choose to focus on something as seemingly simplistic as charts and tables? Because words and pictures are the things that we relate to best. The human brain is particularly good at interpreting pictures, something Stephen Few explores in his book “Show Me the Numbers.” Few presents a fascinating explanation of the human physiology behind this phenomenon and how it has been integral to our very survival as a species.
Here are some ways you can leverage the power of pictures to convey otherwise overwhelming volumes of data.
Pictures provide context
The numerical results of a sophisticated algorithm may seem elegant to a statistician, but a pictorial representation of the same thing allows us to reduce its complexity to something comprehensible to a much wider audience. Here is an example from National Geographic of survey data on well-being broken down by state. The map-like layout highlights regional trends.
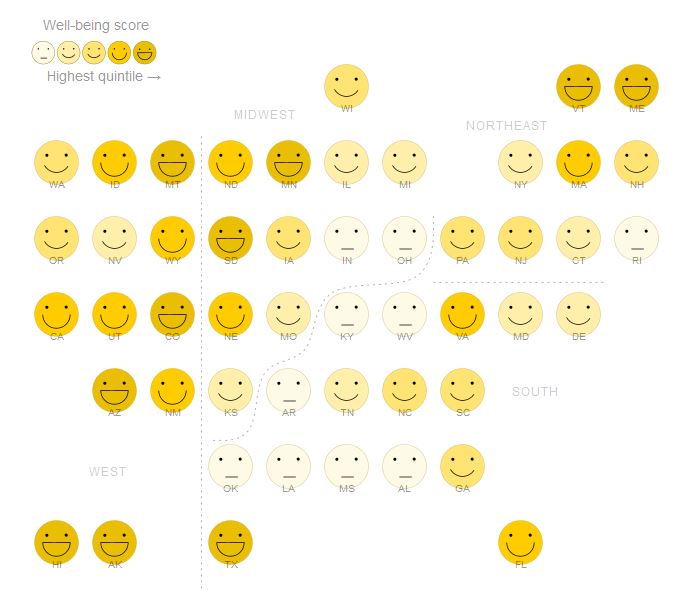
Source: National Geographic
It’s about the story
If pictures can tell the story by themselves, great. But that is rare and you may need to add words. We have always used oral and written stories to share information. Narratives satisfy a thirst of the human mind. Yau does a particularly good job of balancing words and pictures and highlighting others who do it well. You can see many examples on his Flowing Data site, including this one that mixes comics and thousands of years of temperature data.
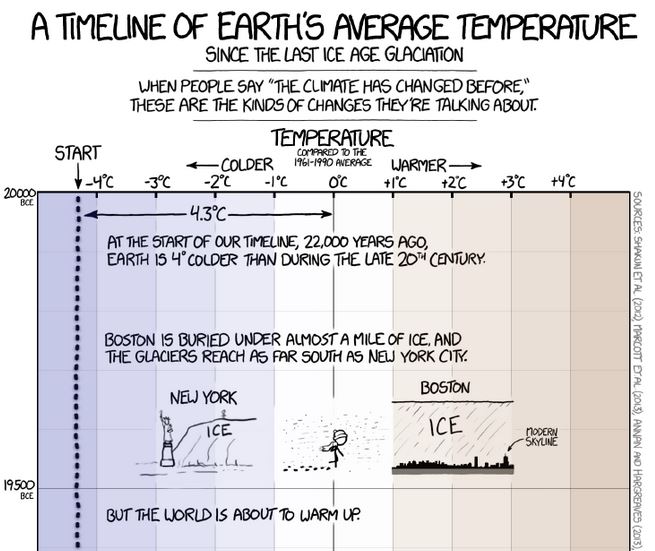
Source: xkcd
There are many possibilities
As with words, there are many variations of ways to tell a story with data visualization. The same dataset can have limitless opportunities for visualization, especially with the availability of animation. Do not be afraid to experiment. Among others, Flowing Data suggests possibilities for different ways to visualize changes over time and different approaches to visualizing proportions.
As analysts, we are both senders and receivers of communication — and they are equally important. So what are the keys to being an effective receiver, consumer, and interpreter of information? I’ll leave you with five lessons that Yau learned through his own evolution as an analyst:
- Seeing the big picture: Don’t get overly consumed with individual data points. Step back and look for patterns and trends that evolve over time.
- Pay attention to detail: Although trends and patterns are important, so are outliers. Don’t ignore them.
- No agendas: Approach data objectively. Don’t let preconceived ideas influence your thinking.
- Look outside the data: Context, metadata, and understanding of the domain are essential to interpreting the numbers. Data does not exist in a vacuum.
- Ask why: Yau considers this the most important one. Whether you notice a blip or a potential correlation, look for the reasons why. The potential answers could be the result of error, bad data, chance, or – after eliminating all the other possibilities – something meaningful.
—
This blog is part of my Practical Analysis series, in which I explore topics integral to understanding information, including analysis, interpretation, communication and more. You can find earlier posts here.

- Practical Analysis: The Next Chapter - May 21, 2020
- Exploratory Data Analysis Part 2: Helping You Make Better Decisions - October 11, 2019
- Practical Analysis: Understanding Visualization Concepts - September 19, 2019