 The emergence of flashy visual dashboards is a developing trend in the business world. It seems like everyone, from local small business owners to the CEOs of multinational conglomerates, is trying to adopt technology with visually engaging displays. However, what many of these displays offer is only a cursory look at the data. By focusing on the trendy outer display, these companies are neglecting the full array of data-driven insights that come with a more comprehensive approach. These dashboards are aesthetically pleasing, but when you strip away the bells and whistles, they off
er nothing more than a static view of the data.
In today’s competitive market, the first answer is rarely good enough. So what are best-in-class companies doing when it comes to dashboards? They are using visual dashboards that allow for data-exploration. By combining visual displays with drill-down capabilities, organizations are allowing non-technical users access to multi-layered data that previously required IT assistance. By expanding the analytical roles of all employees, regardless of job function, they are seeing an increase in decisions derived from analytical processes. This increased reliance on analytics takes the guesswork out day-to-day operations and provides unambiguous return on investment.
Recent research published by Aberdeen Group suggests the potential for further tangible benefits from interactive dashboard use at a company-wide level. Best-in-class companies reap the benefits of interactive dashboards in a variety of quantitative and qualitative measures of success. Data exploration is no longer reserved for technical users. With reports of increased cooperation between departments and enhanced top line and bottom line growth, companies are leveraging the full capabilities of their dashboards to make data analysis a part of everyone’s job description. Do you want to make interactive dashboards an essential part of your company’s approach to data? Download these 5 stats from Aberdeen on the benefits of interactive visualization.
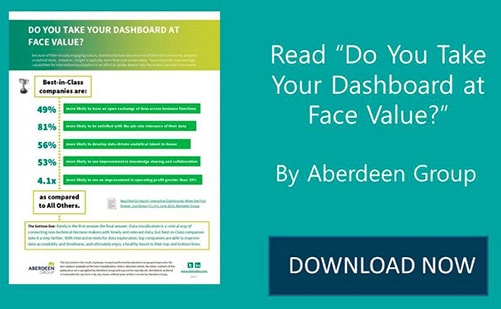
Learn how top companies are using interactive dashboards
Coming up later this week, we’ll take a deeper look at how interactive visual dashboards are benefiting the bottom line of best-in-class companies. Stay tuned.
- DiveTab Mobile BI: What’s New and What’s to Come - October 20, 2016
- 3 Online Resources to Help Sharpen Your Analytics Skills - August 9, 2016
- 5 Must-Haves in a Mobile BI Solution - August 1, 2016