 My last Dashboard Design article focused on how to use the Law of Thirds and the Golden Rule to help designers layout their dashboards. In that article, I redesigned one dashboard layout using the Rule of Thirds principle because on *my* monitor the existing layout looked bad. When I wrote that article, I felt a little uneasy because I knew that the original layout would look good on some monitors. Fact is, what does or doesn’t look good all comes down to screen resolution.
Tweet: How to determine the ideal screen dimensions for dashboards
One of the biggest challenges in designing dashboards is that there are so many different screen resolutions available on computer monitors. I recently checked Google Analytics for statistics on our company website and found that in the last year, our website viewers were seeing it on a total of 801 different screen resolutions! With so many different screen resolutions out there, how can you determine the ideal screen dimensions for dashboards? Let’s find out.
Target your top users
I’m not sure I could ever guarantee that your dashboard could be perfect on every monitor and every screen resolution. But my first piece of advice would be to target your top users. What are they dominantly using to interface with your dashboards?
Now, you might say “I don’t have the time to survey all my users!” … and I believe you. But there is a way to find out what most of your users’ screen resolutions are. It’s done with Google Analytics. If you embed the Universal Tracking code on pages you want to monitor, you can track what devices users are employing to log in to their dashboards.
If you’ve never used Google Analytics, do not fear! It’s very easy and Google offers a ton of tutorials so you can learn any aspect of this powerful online application.
In this article, I’m going to stick to just what is needed for you to uncover the ideal screen resolution you should be designing your dashboards to fit on – and look good within!
First, create a Google account
If you already have a Google account, jump down to step 6. If you don’t, here’s how to do it.
1. Go to https://marketingplatform.google.com/about/analytics/. Figure 1 shows what the screen looked like on the day I wrote this article. (Home page look and feel may change from time to time.)

Figure 1
2. Scroll down until you get to the section of the page that serves as a portal to sign up for Google Analytics. Figure 2 shows you what that looks like.
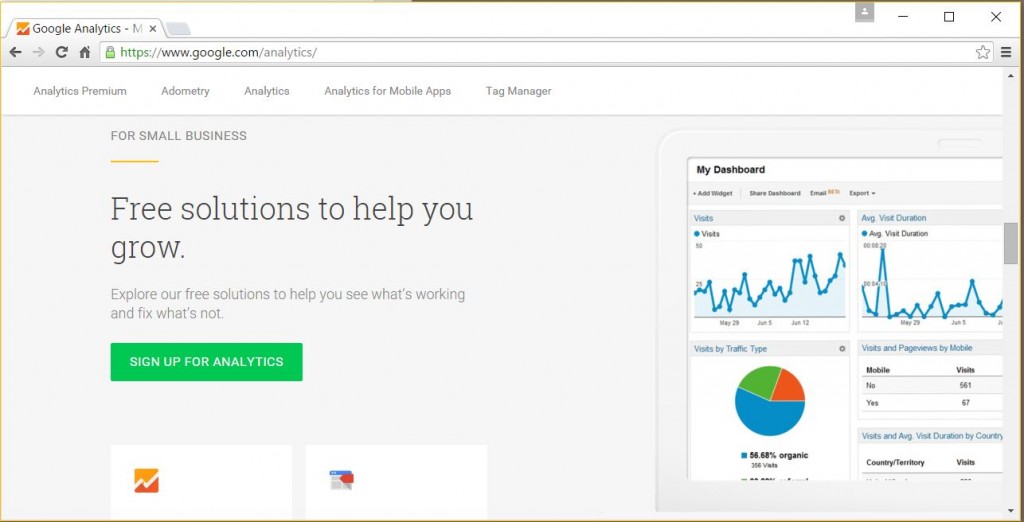
Figure 2
3. Click “SIGN UP FOR ANALYTICS”.
4. Follow the prompts to create an account now.
5. Once you’ve created your account, log out and go back to https://marketingplatform.google.com/about/analytics/.
6. Google displays a simple 3-step process to get started. You’ll start by clicking the “Sign Up” button on the right hand side of the screen. Figure 3 shows what that looks like.
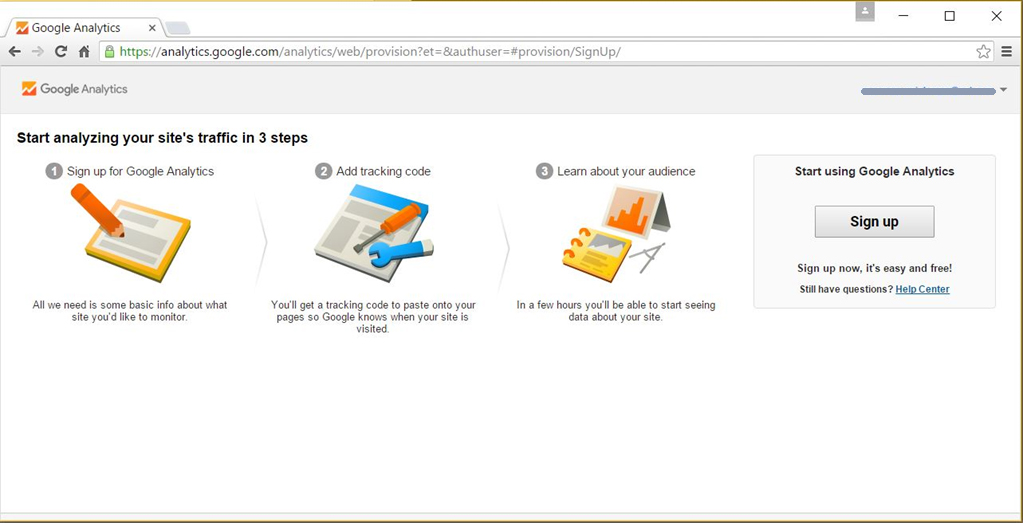
Figure 3
7. The next screen (Figure 4) walks you through the steps to create your new Analytics account, whether it is a website or a mobile site. The last step on this page allows you to get the necessary Tracking ID for your dashboard or DivePort installation.
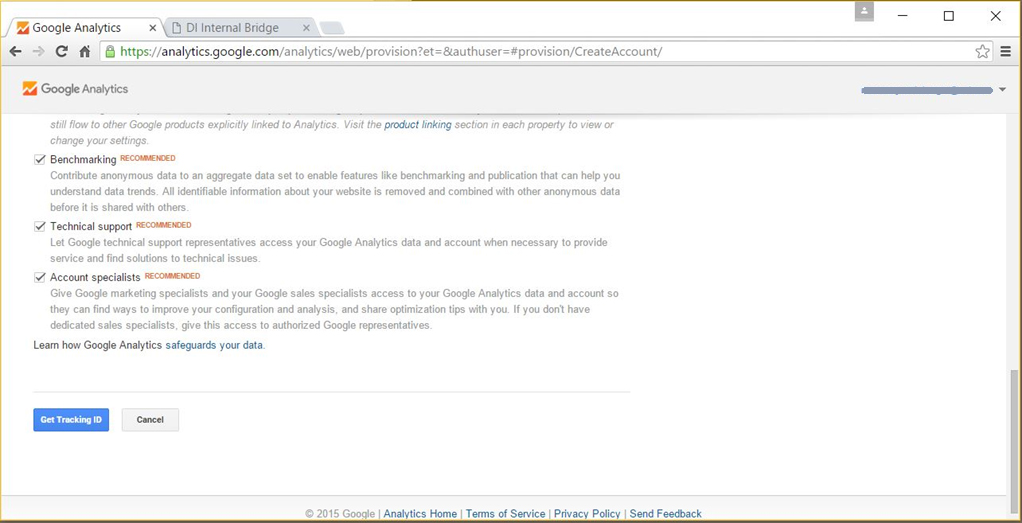
Figure 4
8. Once you click “Get Tracking ID” you will be transported to the “Admin” dashboard for your Google Analytics account. (Figure 5)
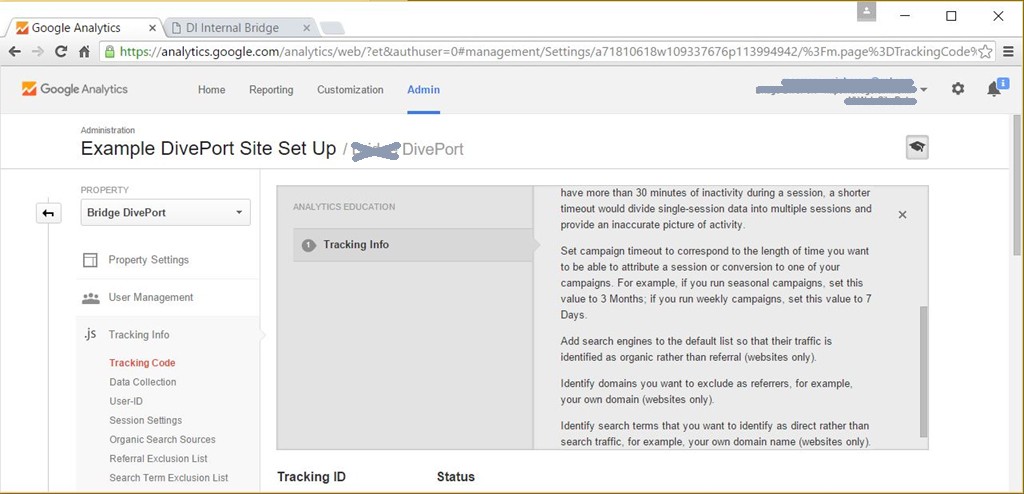
Figure 5
9. Under the subhead “Website Tracking” is a scrollable box containing the script for your Universal Analytics tracking code. Copy and paste it into an HTML Portlet on the DivePort page you want to monitor. If you are not using Dimensional Insight’s DivePort software, paste the code in the header of your cloud-based BI solution web page.
10. Tracking begins immediately; however, it may take a day to relay all tracking information to your Google Analytics account. Once you have some data to observe, you can use your account to determine screen resolutions of your users.
11. Click on “Reporting” in the top navigation bar of your Google Analytics account.
12. The way to capture screen resolution data is under “Audience >Technology > Browser & OS”. Just Click on “Screen Resolution” to get the list of monitor sizes.
Collect data to determine your ideal screen dimensions
As I mentioned before, it will take some time until you have enough data to be able to confidently analyze visits by screen resolution. Only you can know how much data will be significant enough to base your screen dimension decision on.
- How many users do you have?
- Do they always log in from their office or do they often work from home? It would be great if you could wait until you knew all of your users had logged in at least once.
I used Dimensional Insight’s Google Analytics account analyzing the last 6 weeks of user sessions to determine the maximum screen resolution that would allow the entire dashboard to be viewed with no scrolling. By exporting the screen dimension report to Excel and filtering screen size from smallest to largest, I found that 72% of my viewers will see the entire dashboard with no scrolling if I make my dashboards no larger than 1280 x 800. You may decide to make your dashboards no larger than the smallest screen size and be sure that all of your users avoid scrolling. The decision is up to you.
Have fun with your Google Analytics dashboard. It contains lots of other useful information about how your users are accessing your dashboard. Enjoy!


- Meet the Dimensional Insight Team: Gabrielle Amarosa - December 1, 2022
- What You Need to Know About President Biden’s Marijuana Pardon - November 2, 2022
- How to Ace this Year’s OND - September 27, 2022